.png)
Geographic Information System (GIS) University Projects
Gallery
Market Analysis Using Different Geospatial Data Visualization Platforms
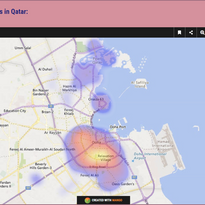
This project demonstrates the value of webGIS in market analysis that helps a client company (Hira Salon) understand Qatar’s market to start its operation/business in Qatar through various examples (maps). Three webGIS platforms have been explored in this project namely ArcGIS Online, Mango Map and CARTO.
A campus storm water runoff project
University are often ideal sites for best-practice sustainability projects including green roofs, energy initiatives, water and ecological designs, recycling and waste reduction and innovative transportation projects. GIS analysis is a key part of such projects.
For example, a Carnegie Mellon University project addresses storm water runoff that causes major flooding at the university. The project will install four concrete, waterproof sectioned tanks - 80 feet long, 16 feet wide, and 10 feet high - under one of CMU's "mall" areas between the College of Fine Arts lawn and Hamerschlag Hall. The installation will help mitigate flooding during storms by collecting runoff from the downspouts and catch basins of buildings along the mall. The underground tanks will collect runoff that can be reused for the campus chilled water cooling system. Trees, most effective at reducing runoff from smaller storms, also reduce storm water runoff by capturing and storing rainfall in the canopy and releasing water into the atmosphere.
My task in this assignment was to prepare GIS layers for facility planners by digitizing polygons for the green spaces and points for the trees in this mall.


Digitized Police Beats
Community oriented police officers are responsible for preventing crime and solving underlying community problems related to crime. Among other activities, these officers walk specific geographic areas or "beats" which are small networks of streets in specified areas. Often the beats are designed in cooperation with campus police who help set policing priorities. Beats change as problems are solved and priorities change. Therefore, having the ability to digitize and modify police beats is a good idea.
In this assignment I digitized two new polyline police beats for the city of Pittsburgh Bureau of Police district near the Carnegie Mellon University campus based on street centerlines that make up these beats.


Produced a neighborhood block watch crime map


Feature Classes
-
Bldgs: Has polygon features for building footprints (digitized rooftops from aerial photographs) in the Middle Hill. Bldgs is used for spatial context.
-
CADCalls: The subject of the map has point features for 911 computer aided dispatch police calls in the Middle Hill Neighborhood of Pittsburgh. Attributes of interest include:
-
Nature_Code = call type code
-
CallDate = date of incident
-
Address = address of incident location
-
-
Curbs: Its digitized and is for spatial context. It has line features for street centerlines in the Middle Hill. It does not have street names, so next feature class is in place.
-
Streets: The streets are so-called TIGER streets from the US Census Bureau. It has line features for street centerlines in the Middle Hill.
-
Outline: A polygon feature class with the boundary of the Middle Hill neighborhood.
Symbology
CADCalls: Bright Red circle # point markers, size 6 pt.
Outline: No color and 80% gray outline, size 1.5
Bldgs: No color for border and 50% gray color
Curbs: 30% gray with 0.5 pt. line width.
Streets: No display but will use FName attribute to label curbs in the next bullet. 70%gray font color, size 7. White Halo with no boundary, size 0.5.
Selection Color: Bright Blue.
Geocoded grocery stores in Allegheny County
Geocoded grocery stores in Allegheny county first by ZIP code and then by street address. There was a high match rate for ZIP Codes but low granularity of spatial location. For streets, the opposite occurred.

Chloropleth map using the count of grocery stores by ZIP code and street address-matched grocery store points symbolized differently using store size.

Chloropleth map using the count of grocery stores by ZIP code and street address-matched grocery store points symbolized differently using store size.
Statics for ZIP Code

Statics for Streets

A layout with income versus educational attainment in Washington, DC
Generally higher educational attainment leads to better paying jobs. I created a map layout comparing per capita income versus percent of population with a bachelors degree or higher in Washington, DC, by census tract. You'll see which parts of Washington, DC, have high and low income educational attainment, plus a scatter plot of those two attributes.

Chloropleth Map Layer for per capita income and a graduated symbol map layer for percentage of population 25 or older with bachelors degree or higher.

Per Capita Income (PerCapInc) versus percentage of population 25 or older with bachelors degree or higher ( with the dependent variable PerCapInc on the vertical axis).Limited x-axis values to a maximum of 100 and y-axis values shown as currency.

Chloropleth Map Layer for per capita income and a graduated symbol map layer for percentage of population 25 or older with bachelors degree or higher.
Map Layout
It compares per capita income versus percent of population with bachelor’s degree or higher in Washington, DC, by census tract. In this map layout you can see which parts of Washington, DC, have high and low income and educational attainment. In figure 2 you see a scatterplot of per capita income versus percent of population with bachelor’s degree or higher. We can see in the scatterplot that as the education attainment increased, the range of per capita income also shifted upward with heavy concentration in between $20,000 - $80,000.


